For those new to solar this year, or those who have been monitoring solar production, its been a pretty bad year for solar. We have been keeping records from our monitoring systems for while and we can see there has been a drop.
Solar power is poised to be the star performer in the renewable energy landscape in 2024. Falling costs of photovoltaic technology, coupled with advancements in energy storage systems, will make solar energy an increasingly competitive and viable option. But if the production yields are down its not a good start.
Daylight 2024 figures
| January | 259 hours and 5 minutes |
| February | 286 hours and 45 minutes |
| March | 366 hours and 18 minutes |
| April | 414 hours and 17 minutes |
| May | 482 hours and 39 minutes |
| June | 496 hours and 20 minutes |
Daylight 2022
| January | 259 hours and 5 minutes |
| February | 275 hours and 59 minutes |
| March | 364 hours and 15 minutes |
| April | 412 hours and 23 minutes |
| May | 481 hours and 7 minutes |
| June | 495 hours and 59 minutes |
| July | 501 hours and 30 minutes |
While daylight hours from 2022 are lower in the first part of the year the sun shine which makes all the difference in terms of value that a customer may see from their solar installation. if we look at 2021 in the charts below we can see a massive difference in the April and May figures.
Average Maximum Solar Energy Charts
| Solar Energy (kWh) | |||||||||||||
|---|---|---|---|---|---|---|---|---|---|---|---|---|---|
| Date | Jan | Feb | Mar | Apr | May | Jun | Jul | Aug | Sep | Oct | Nov | Dec | Year |
| 2024 | 24.7 | 34.3* | 65.8 | 103.0* | 128.0 | 50.4* | — | — | — | — | — | — | 406.2* |
| 2023 | 24.9 | 34.7* | 56.6 | 65.4 | 156.8 | 174.1* | 130.1 | 112.9 | 90.9 | 54.4 | 27.6* | 14.2 | 942.6* |
| 2022 | 18.5 | 31.4* | 68.2 | 122.0* | 146.8 | 151.3* | 160.0 | 132.5 | 82.8* | 58.2 | 22.8* | 15.2 | 1009.7* |
| 2021 | 24.8 | 44.9* | 88.6 | 160.2* | 165.3 | 148.7* | 139.2 | 101.7 | 80.0* | 42.4 | 26.9* | 12.4 | 1035.1* |
| 2020 | — | 31.1 | 75.6 | 122.8 | 174.3 | 136.8 | 137.8 | 110.9 | 90.5* | 42.4 | 23.4* | 15.7 | 961.3* |
Data from https://crondallweather.co.uk/
We had wrote an article on global dimming which was taken from our previous website where we looked into the global effects which effects solar production from the suns behavior ( Solar dimming and the suns cycle).
The weather in the UK is .. English weather which is world infamous. However the weather is effected by the gulf stream, the north Atlantic playing a large role in how much cloud and rain we see. You can learn the details here.
The Gulf Stream system of warm ocean currents could collapse as early as 2025, a scientific study has warned.
The end of the system, which drives the Atlantic’s currents and determines western Europe’s weather, would likely lead to lower temperatures and catastrophic climate impacts. But leading scientists have reservations about the study and say it is not established science.
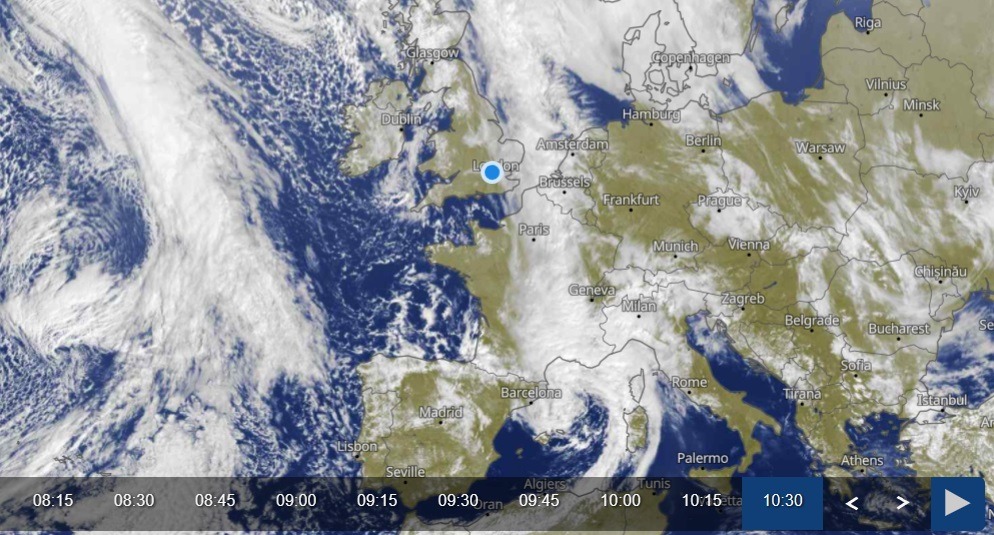
The warming water makes clouds in the sky which can lead to rain, but will dampen solar production as well. Bellow is an image of the stream and the “formation” areas. it may seem high, but you should remember the general impression of the flat planet gives you a false pretense, this convection area is more to the left of the UK as the earth spins left.

When we view this live image from above Cloud radar – Live satellite images
You should tilt your head to the right about 30 degrees.
Solar performance will be up and down as it will always be, but don’t forget that this year is not the best year for solar. Remember that panel position is key to how your system will perform. roof top system with “standard fit” will notice more yearly drops that purpose installations.
Worried about solar and how it will work for you or what you can do to make more of solar and lower your bills or just gain more power from the sun? RenewSolar Offers consultations and project management.
No responses yet