Have you ever wondered if you can calculate solar production more accurately?
Here is how you can….
Knowing your solar array installation is one of the things that you will learn if you are monitoring it on a regular basis. You will be able to look out the window and say, oh 1.5kW, then check and be in the ball park. but before that skill kicks in, you need some imperial data…
Imperial data is set, known or verified accurate data.

You will need to know that in 4 minutes the sun will RISE 1 degree. (altitude)
You also need to know that the sun ROTATES across the sky 15 degrees in one hour.
lets check two places, slide the sun to find the maximum RISE:
Sun & moon times today, 52°03’45″N, 1°16’47″W (timeanddate.com)
Sun & moon times today, Baildon, England, United Kingdom (timeanddate.com)
Sun & moon times today, Glasgow, Scotland, United Kingdom (timeanddate.com)
What did you notice? Well firstly there is a difference of 3 degrees, however the maximum (meridian) has changed times also.
If you read our article on panels positions, then you would be aware that the SUN angel to the panel is around -35 to +35 degrees. You will know that this is roughly just under 50% on the fringes and so you should be able to TIME your peak solar, and know when it will be.
There is one other thing that will rain on your parade and that’s going to be cloud. ( hope you liked the pun!!)
The met and others provide data but its a little more convoluted due to the fact they don’t seem to know how to do the weather… but lets look here:

This can be found here: Radar Live: CLOUD RADAR – Satelitte cloud cover map (radar-live.com) as you can see the cloud data is every 15 minutes, and if you watch, the “flow” has a pattern as the world spins.
but you would be able to predict where the cloud will be by looking at the data..
Over on this website Weather Map: Precipitation – The Weather Network you will see I have selected rain. (right side of the page, cloud, rain wind…) so this is more dense clouds, but the lighter clouds have to be followed as these can vary in solar transmission.
Putting it all together
- Sunrise and Sunset Angles:
- The sun’s movement from sunrise to sunset covers an angle of 161 degrees.
- Since Earth rotates approximately 15 degrees per hour, this corresponds to approximately 10.73 hours of sunlight.
- Optimal Panel Angles:
- Your solar panels work best within an angle range of -35 to +35 degrees.
- This leaves an effective range of 70 degrees for power generation.
- Productive Hours:
- Considering the optimal panel angles, the “productive hours” are approximately 4.667 hours (70% of the total daylight hours).
- Considering the optimal panel angles, the “productive hours” are approximately 4.667 hours (70% of the total daylight hours).
- Horizontal Time (South-Facing Panels):
- The solar peak occurs at an elevation angle of 31 degrees.
- To calculate the horizontal time for direct south-facing panels:
- Sunrise is at 6:44 AM (0 degrees).
- Add 319.98 minutes (which corresponds to 31 degrees).
- The solar peak occurs between 11:40 AM and 12:57 PM (a duration of 1 hour and 17 minutes).
- Vertical Times (Applying Roof Angle):
- Assuming a roof angle of 45 degrees:
- The solar start time (when the sun reaches 10 degrees) is 07:54 AM.
- The angle varies based on the roof angle, but this provides a reference point.
- Assuming a roof angle of 45 degrees:
- Panel Orientation:
- At 07:54 AM, the panels should be approximately 50% efficient.
- They will rise throughout the day until reaching their peak efficiency around 12:12 PM.
- After that, efficiency will gradually decrease, coming back to around 50% by 16:38 PM.
What you will notice, is that the high vertical in this example 45 degree roof, +35 degrees is 80 degrees. The sun only reaches 65 degrees in the UK, so your panels are “out of alignment” by 15 degrees (one hour) of course the 35 degrees is the outsider performance value. Therefore the panel is in by 1 hour and nearer to maximum performance.
The down side of this is that your missing winter sun when it is lower in the sky and there are less sun hours to gather your solar power…
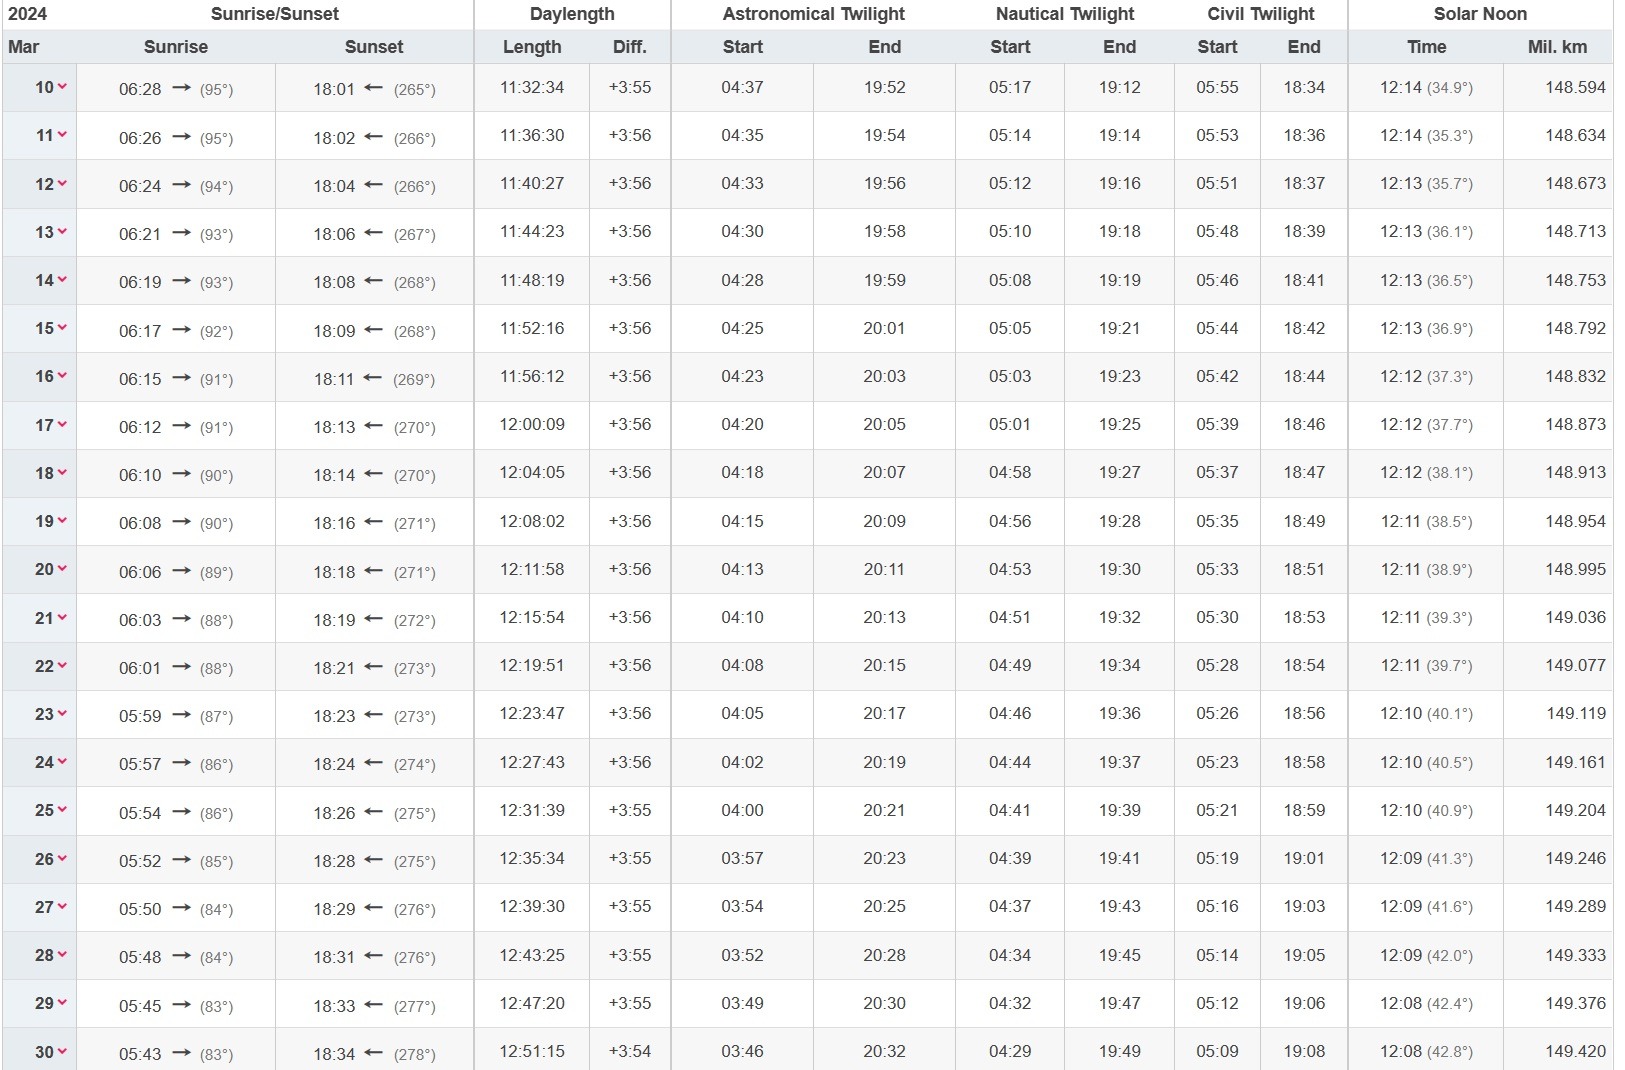
Sun in 51°16’26″N, 1°05’26″W – Next 7 Days
| 2024 | Sunrise/Sunset | Daylength | Solar Noon | |||
|---|---|---|---|---|---|---|
| Mar | Sunrise | Sunset | Length | Diff. | Time | Mil. km |
| 3 Mar | 06:44 | 17:49 | 11:05:08 | +3:53 | 12:16 (32.2°) | 148.321 |
| 4 Mar | 06:41 | 17:50 | 11:09:02 | +3:54 | 12:15 (32.6°) | 148.359 |
| 5 Mar | 06:39 | 17:52 | 11:12:57 | +3:54 | 12:15 (33.0°) | 148.398 |
| 6 Mar | 06:37 | 17:54 | 11:16:52 | +3:54 | 12:15 (33.4°) | 148.437 |
| 7 Mar | 06:35 | 17:56 | 11:20:47 | +3:55 | 12:15 (33.8°) | 148.476 |
| 8 Mar | 06:33 | 17:57 | 11:24:43 | +3:55 | 12:14 (34.2°) | 148.515 |
| 9 Mar | 06:30 | 17:59 | 11:28:38 | +3:55 | 12:14 (34.6°) | 148.555 |
As you will notice, over the days ( Solar noon times) the sun angles increases 0.4 degrees a day. The Day length increases by 3.54 minutes each two day (ish).
If we have FLAT SOLAR PANELS the Solar noon will play a large part in the performance calculations, as the panels will be fined at 0 degrees ( facing up) therefore the over head position must be 90 degrees (directly above) +-35 degrees.
We know that 55 Degrees of the Solar noon will give us 50% (ish) power from our panels. This will occur on the 19th of April 2024, Ending 24th of September 2024. ( max 61.2o 19th June 2024 13:05)
This may seem a little unfinished, but I’m sure you get the idea on how you calculate the solar performance based on the sun position and the panels alignment. The times vary over the year, which will give you your peak times, based on the panel angle relative to the sun.
We cannot calculate the clouds and what difference this makes as they have a variable density. but we can work on clear sky’s We also need to understand the radiance (insolation) and the panel efficiency if we want to know before hand what the power output will be. With this knowledge you can see why we consult on solar.
What we can do with this information is balance our array and power to give us what we want, when we want.

it seems as https://www.timeanddate.com/sun/ is a great site to get the information from.
The cloud data is good here: Cloud radar – Live satellite images | SAT24

Here : https://solcast.com/ They show the radiation values.

No responses yet