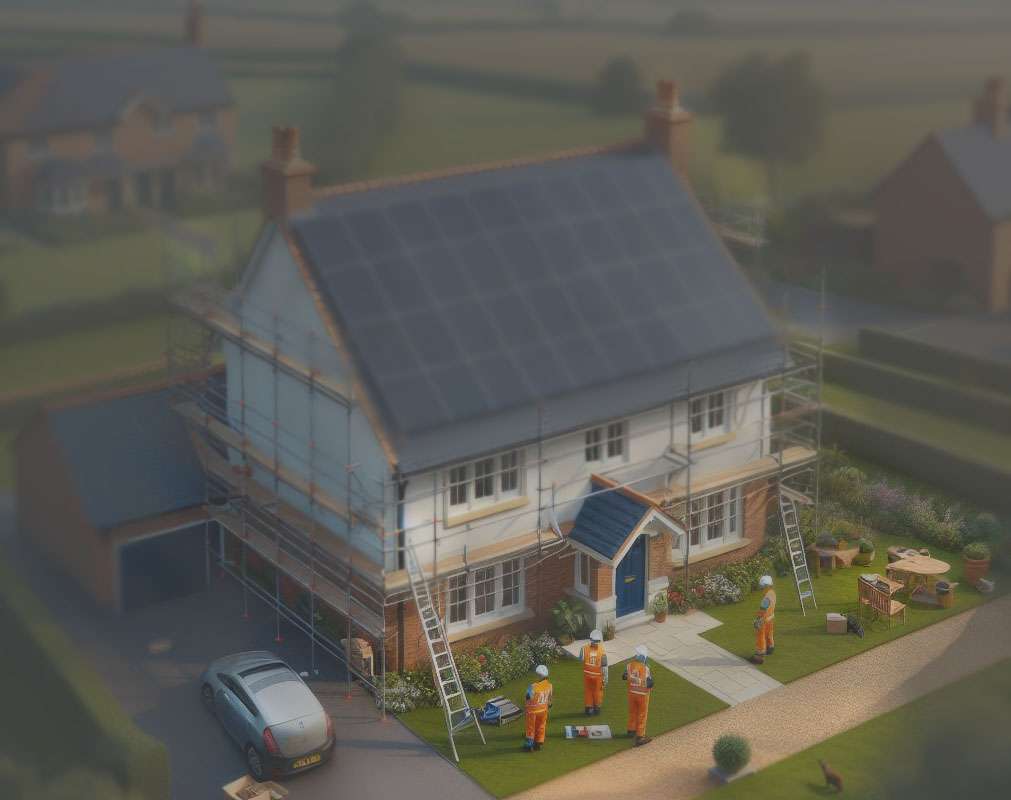
Energy Embodied in Solar Panels: A Complex Question
Determining the exact amount of energy that goes into producing a home solar installation is challenging due to several factors:
- Complexity of Production: Solar panels involve a complex manufacturing process, using various materials and energy-intensive steps.
- Material Sourcing: The energy required to extract and process raw materials like silicon, aluminum, and glass varies widely based on location and method.
- Manufacturing Processes: Energy consumption in different manufacturing stages (e.g., crystal growth, cell production, panel assembly) varies significantly.
- Transportation: Energy is consumed in transporting materials and finished products.
- Geographical Location: Energy sources and efficiency vary across regions, impacting the overall energy footprint.
General Estimates
While precise data is difficult to obtain, some studies and estimates provide insights:
- Energy Payback Period (EPP): This is the time it takes for a solar panel to generate the same amount of energy used in its production and installation. Estimates range from 2 to 4 years, with improvements in manufacturing efficiency leading to shorter EPPs.
- Energy Intensity: The amount of energy required to produce a kilowatt-hour (kWh) of solar panel capacity has been decreasing over time. However, specific figures can vary widely.
- Solar cycling: Much of the factories are powered by solar panels and parts of the shipment are moved with electrical vehicles which in part negates some of the energy used.
Factors Influencing Energy Consumption
Several factors influence the energy embodied in solar panels:
- Panel Type: Different types of solar panels (monocrystalline, polycrystalline, thin-film) have varying energy requirements.
- Manufacturing Efficiency: Technological advancements and improved production processes can significantly reduce energy consumption.
- Renewable Energy Usage: Manufacturers using renewable energy sources for their operations reduce the overall carbon footprint.
Importance of Considering Embodied Energy
While solar panels offer a clean and renewable energy source, understanding their embodied energy is crucial for a complete lifecycle assessment. By considering factors like EPP and energy intensity, consumers can make informed decisions about the environmental impact of their solar installations.
To get a more accurate estimate for a specific solar panel model, you might consider contacting the manufacturer directly.
Battery Power Energy
How much is the Energy Consumption for Producing 1 kWh of LFP Batteries?
The energy required to produce 1 kWh of LFP batteries is estimated to be between 37.5 kWh and 8.2 kWh.
Factors Affecting Energy Consumption
- Current production methods: These are relatively energy-intensive, requiring around 37.5 kWh per kWh of battery produced.
- Technological advancements: The industry is rapidly evolving, with improvements expected to reduce energy consumption significantly. Estimates suggest that by 2040, it could be as low as 12.9 kWh per kWh of battery.
- Manufacturing processes: The specific steps involved, such as coating, drying, and formation, consume a substantial amount of energy.
- Energy efficiency: Improvements in equipment and processes can lead to reduced energy consumption.
Key Points
- LFP batteries currently have a higher energy consumption in production compared to other lithium-ion battery types.
- The energy efficiency of LFP battery production is expected to improve significantly in the coming years. 1.
- The overall environmental impact of LFP batteries also depends on the energy source used in the manufacturing process.
It’s important to note that these are estimates, and the actual energy consumption can vary depending on various factors.
Energy Embodied in Solar Inverter Chargers
Determining the exact energy consumption for building a solar inverter charger is complex due to several factors:
- Component complexity: Inverters and chargers consist of various components like semiconductors, transformers, and cooling systems, each with its own energy footprint.
- Manufacturing processes: The energy intensity of processes like smelting, refining, and assembly varies widely.
- Material sourcing: The energy required to extract and transport raw materials can be significant.
- Geographical location: Energy sources and efficiency differ by region.
General Considerations
While specific data is limited, we can make some general observations:
- High energy intensity: Due to the electronic components and manufacturing processes involved, solar inverter chargers are likely to have a relatively high embodied energy.
- Efficiency improvements: The industry is continually advancing, leading to more efficient production methods and reduced energy consumption.
- Material choice: Using recycled materials can help lower the embodied energy.
Importance of Embodied Energy
Understanding the energy required to produce a product is crucial for assessing its overall environmental impact. While solar energy generation is clean, considering the energy invested in producing the equipment is essential for a complete picture.
To get a more accurate estimate for a specific inverter charger model, contacting the manufacturer would be beneficial.

Most of the worlds solar panels are from China as are many things that we have and use of a daily basis. Running the biggest industrial SME’s creates a need for energy production as you would exspect. China has made considerable advances and eco energy from Solar wind and hydro power the countries industry.
Rapid Growth of Renewables: In recent years, China has made substantial investments in renewable energy, particularly solar and wind power. It’s now the world’s largest producer of both.
Challenges and Progress:
Despite significant progress in renewable energy, China still faces challenges:
Energy Storage: Developing efficient energy storage solutions is crucial for the widespread adoption of renewables.
Balancing Growth and Environment: Meeting the demands of a growing economy while reducing emissions is a complex task. China backbone of power generation has been coal with a large environmental impact. However in the same breath China has the largest global green energy projects.
Grid Integration: Integrating large amounts of intermittent renewable energy into the grid requires advanced technologies and infrastructure.
Green Power Share
While exact figures can fluctuate, it’s clear that green power (primarily solar, wind, and hydro) is rapidly increasing its share of China’s energy production. The country has set ambitious goals for renewable energy development, and its progress in this area is noteworthy.
General Trends in “going green”
We can outline some general trend in the main global markets to the “change” in “green energy”. Many countries have made and failed there targets only to make new targets and the general claims of the failures is the small wars and still the pandemic of Covid-19 some 5 years ago here is the general info:
- Europe:
- Generally considered a leader in renewable energy adoption.
- Many European countries are on track or ahead of their renewable energy targets.
- However, the energy crisis has highlighted the need for accelerated efforts in some areas.
- United Kingdom:
- Has set ambitious renewable energy goals.
- Progress has been made, but challenges remain in areas like offshore wind and energy storage.
- United States:
- Progress has been made, particularly in solar and wind power.
- However, the pace of deployment needs to accelerate to meet long-term climate goals.
It is worth noting that the EU seems to be hitting more targets, there are some countries in the EU that are falling behind. The EU can be self serving its members as they are a land mass making what’s good for one, good for all. However while the USA is a land mass much the same as the EU it does not seem be hitting the targets it has set.
The U.S.A. must add 60 to 127 GW of capacity this year to stay on track, the report by researchers from Princeton University, Massachusetts Institute of Technology, Rhodium Group and the non-profit Energy Innovation said, adding that installations are likely to fall short of that range. Beyond 2024, the groups said clean energy installations should increase even further to between 70 and 126 GW a year.
in summary they are around just 30-40% of their targets.
No responses yet